At Booko, we use New Relic to measure performance. When deploying a new change, it’s good to watch New Relic and see how performance is impacted by the latest changes.
Recently we fixed a bug related to the list functionality of Booko. Every browser viewing Booko polls the servers for the price of the user’s list every two seconds until the prices are up-to-date. The bug caused the browser to poll when there was no need to – essentially making every browser hit Booko every two seconds. These requests were really fast to respond to – essentially with the message “You’re good – no change, stop talking to me.”. After fixing this bug, here’s what New Relic displayed:
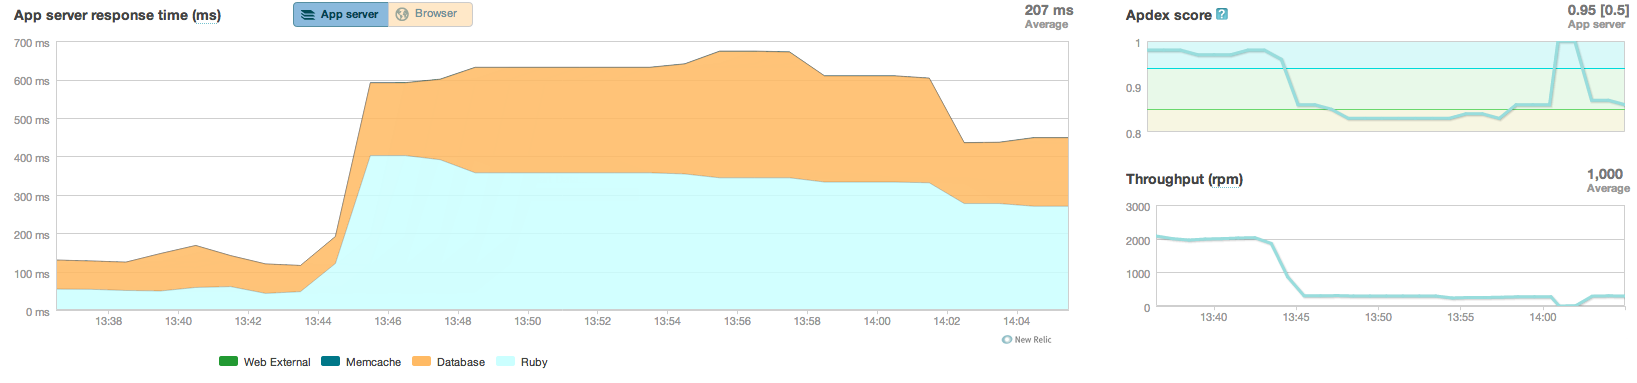
The bug fix went in at 13:40-something. Apparently response times shot up from < 200ms to ~ 600ms. What happened?
I think the hint is in the Throughput graph. RPM dropped from 2000 / minute to somewhere around 200. I suspect that New Relic averages your response times and since we removed 90% of requests which were all fast, the average response time jumped up and the Apdex score crashed down from Awesome to Meh.
All this just reinforces that it’s good to know what you’re measuring. The average response time is interesting, but in this case the average was not representative of Booko user experience.